How to Price a Multi-Site Warehouse Contract
Multi-site 3PL contracts are where pricing gets genuinely complex. Different EBAs, different rent profiles, different equipment configurations — all needing to produce a consistent, auditable proposal. This guide covers the methodology.
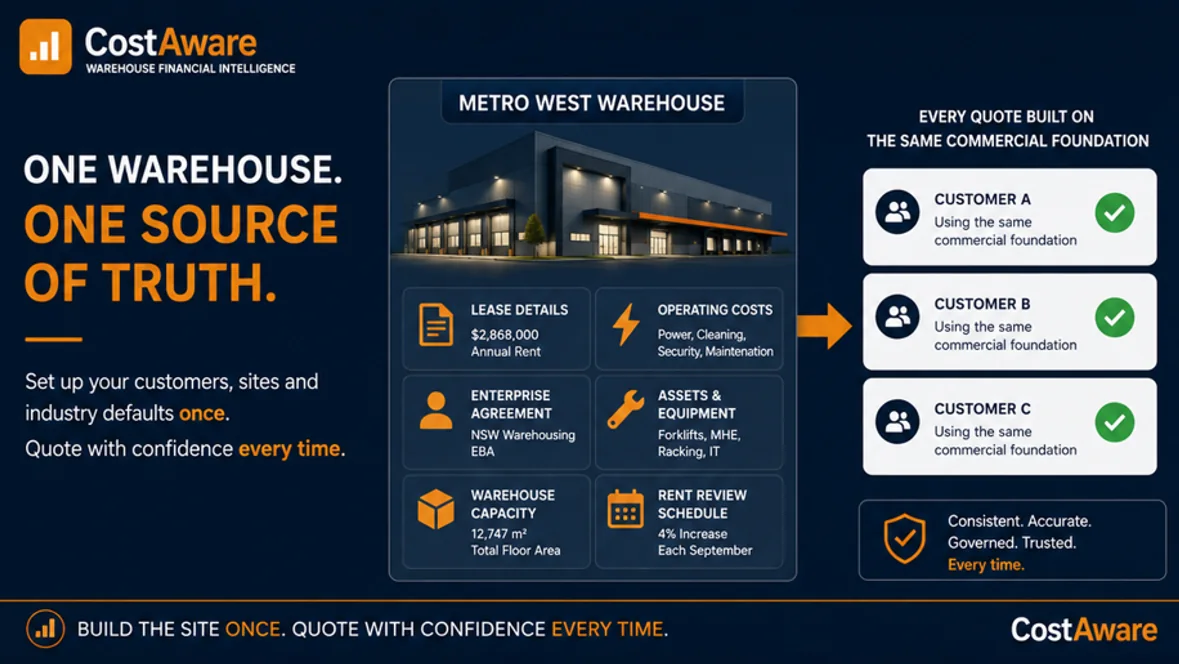
Why Multi-Site Is Different
A single-site warehouse cost model is straightforward in concept: volumes go in, costs come out, rates appear on a rate card. You can manage this in a well-built spreadsheet, though it gets unwieldy.
A multi-site contract adds a dimension that spreadsheets handle poorly. Each site has its own cost structure, but the customer expects a unified proposal. They want to see how costs vary by location, what the consolidated annual budget looks like, and how rate cards compare across sites.
The challenge isn't just having multiple sets of numbers. It's keeping those numbers consistent when they share common assumptions (corporate overhead, margin percentages, contract terms) while respecting site-specific realities (local EBAs, state-based payroll tax, different rent escalation rates).
The Site-Level Foundation
Every multi-site model starts with independent site-level cost models. Each site needs its own complete cost stack, calculated from its own inputs.
| Input | NSW Site | VIC Site | QLD Site |
|---|---|---|---|
| Enterprise Agreement | EBA AP30 | EBA L88 | EBA L1 |
| Base hourly rate | $31.47 | $29.85 | $30.12 |
| Payroll tax rate | 5.45% | 4.85% | 4.75% |
| Workers comp rate | 1.78% | 1.52% | 1.65% |
| Rent per SQM | $185 | $145 | $120 |
| Rent increase (annual) | 4.0% | 2.5% | 3.5% |
| Warehouse area | 12,747 SQM | 8,200 SQM | 6,500 SQM |
These differences cascade through the entire model. A higher base wage in NSW doesn't just increase labour cost; it changes the FTE cost, which changes the Activity cost pool, which changes the ABC allocation, which changes every rate on the rate card. State-specific payroll tax and workers' compensation rates compound the effect.
Shared Assumptions
While site-specific inputs vary, certain assumptions are typically set at the contract level and applied consistently across all sites.
- Corporate overhead percentage (typically 3%) — head office cost recovery
- Margin percentage (typically 12%) — target profit margin
- Labour utilisation (typically 85%) — non-productive time allowance
- Productive hours per day (typically 7.6 hours) — standard shift length
- Contract term (typically 3-5 years) — for asset amortisation and rent escalation
These shared assumptions ensure that the commercial terms are consistent. You don't want one site priced at 10% margin and another at 14% because someone copied a different version of the spreadsheet.
The Rollup Problem
Once each site has its own cost model, the contract-level view needs to aggregate them. This is where many spreadsheet-based models fail.
The rollup needs to aggregate specific fields from all sites into contract-level totals. Total fixed costs, total activity costs, total wages, total salary costs, total asset capital expenditure, and total rate card revenue must all sum correctly regardless of how many sites are in the contract.
Contract Total Activity Cost = SUM(Site[i].TotalActivityCost) for all sites
Contract Total Wages = SUM(Site[i].TotalWages) for all sites
Contract Total Budget = SUM(Site[i].TotalWarehouseBudget) for all sites
Consolidated Annual Budget
The customer typically wants to see a consolidated annual budget that shows costs by category across all sites, plus a combined total column. This is one of the most useful views in a multi-site proposal because it lets the customer compare cost structures between locations.
| Category | NSW | VIC | QLD | Total |
|---|---|---|---|---|
| Fixed Costs | $745,664 | $482,300 | $361,700 | $1,589,664 |
| Asset Costs | $89,200 | $62,400 | $45,800 | $197,400 |
| IT Costs | $32,960 | $24,100 | $18,700 | $75,760 |
| Salary Costs | $187,680 | $165,200 | $142,800 | $495,680 |
| Activity Costs | $489,506 | $312,400 | $245,600 | $1,047,506 |
| Services | $127,937 | $95,200 | $72,400 | $295,537 |
| Base Warehouse | $1,672,947 | $1,141,600 | $887,000 | $3,701,547 |
| Corp Overhead (3%) | $50,188 | $34,248 | $26,610 | $111,046 |
| Margin (12%) | $200,754 | $136,992 | $106,440 | $444,186 |
| Total Budget | $1,923,889 | $1,312,840 | $1,020,050 | $4,256,779 |
Illustrative figures. Actual values depend on site-specific inputs.
Rent Escalation Across Sites
Rent escalation is one of the trickiest aspects of multi-site contracts because each state has different market norms. NSW might escalate at 4% annually, Victoria at 2.5%, Queensland at 3.5%. These aren't arbitrary; they reflect market conditions and lease terms in each location.
The escalation typically applies from a specific anniversary date, not from the contract start. If the lease anniversary is in September, months 1 through 8 of the first year use the base rent, and months 9 through 12 get the escalated rate.
Over a 3-year contract term, these differences compound significantly. A $185/SQM rent in NSW at 4% escalation reaches $203/SQM by year 3. The same starting rent in Victoria at 2.5% would only reach $194/SQM. On a 12,000 SQM warehouse, that's a $108,000 annual difference by year 3.
Rate Card Consistency
In a multi-site contract, each site produces its own rate card. The rate card structure (which activities are billable, how they're described) should be identical across sites. The rates themselves will differ because of different input costs.
The customer will compare rates between sites. If your carton pick rate is $1.40 in NSW and $1.15 in Queensland, they'll want to understand why. With proper ABC cost allocation, you can show that the difference comes from higher wages (EBA difference), higher rent (market rates), and higher workers' compensation (state regulation), not from different methodology or hidden margins.
Financial Returns
Beyond the annual budget, multi-site contracts need multi-year financial projections. A multi-year P&L for each site (CostAware projects out to 10 years) shows how costs escalate with CPI, how rent increases compound, and what the margin looks like over the contract term.
The balance sheet view adds asset depreciation (racking, dock levellers, MHE), debtors based on payment terms, and employee provisions. These are critical for understanding the capital commitment and cash flow implications of a multi-site contract.
The Spreadsheet Breaking Point
A single-site cost model in Excel might have 15-20 tabs and 3,000 formulas. A 3-site contract triples this, plus adds consolidation sheets. You're looking at 50+ tabs, 10,000+ formulas, and a file that takes 30 seconds to recalculate.
The risk isn't just complexity. It's that when someone copies the NSW model to create the Victorian model, cell references break. When they update a shared assumption, they have to remember to update it in three places. When they add a fourth site for a contract extension, they have to rebuild the consolidation logic.
These aren't hypothetical risks. They're the reason 3PL operators regularly find pricing errors worth six figures over a contract term.
What a Structured Approach Looks Like
A structured cost modelling platform handles multi-site contracts by maintaining independent site cost models with shared contract-level assumptions. When a volume changes on one site, only that site recalculates. When a contract-level assumption changes (margin percentage, for example), all sites recalculate simultaneously.
The consolidated budget, financial returns, and rate card comparisons are generated automatically from the underlying site data. Add a fourth site and the consolidation includes it without rebuilding any formulas.
The audit trail is complete: every rate on every rate card traces back through ABC allocation to cost pools to FTE calculations to volume inputs. No broken cell references. No hidden rows. No wondering which version of the spreadsheet is current.
Multi-Site, Without the Spreadsheet Risk
CostAware handles multi-site warehouse contracts with automatic consolidation and consistent methodology across all locations.
Learn More →