How to Price a 3PL Contract: A 7-Step Framework
What Goes Into Pricing a 3PL Contract
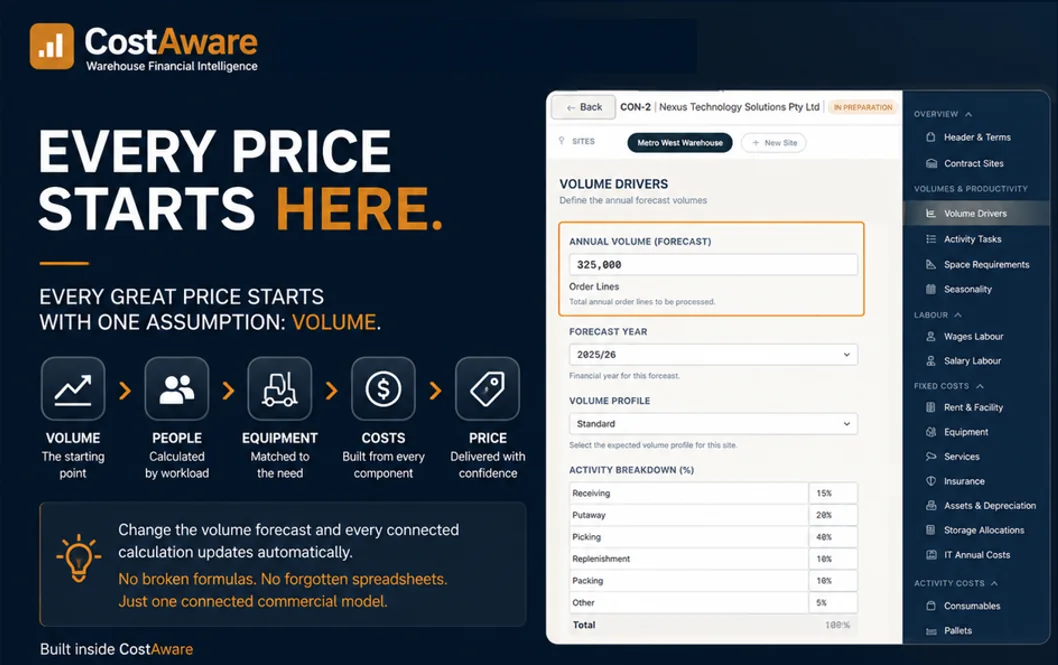
A 3PL contract price is not a single number. It is a layered model that connects a customer's volume forecast to your site's operating cost structure, then expresses the result as per-unit rates the customer can verify against their own data. The pipeline looks like this: volumes in, labour requirements out, cost stack built, costs allocated, rates generated, margin applied, budgets delivered.
Most operators run this in spreadsheets. That works for a single site with stable volumes, but it breaks down with multi-site contracts, contract renewals, or mid-term repricing. The framework below applies regardless of tool — though automation changes the economics dramatically.
Step 1: Understand the Customer's Volumes
Everything starts with volumes. You need a clear picture of what the customer moves through your warehouse each year, broken into channels that map to distinct operational activities.
The key inputs typically include:
- Inbound throughput — pallets unloaded per annum (e.g. 1,700), containers received (20ft and 40ft), loose cartons
- Storage on-hand — standard pallets (e.g. 36,000), dangerous goods pallets, oversized pallets
- Outbound orders — total orders per annum (e.g. 62,000), split by channel: normal despatch, special/premium, export
- Order complexity — lines per order, units per line, cartons per order
- Special handling — DG orders, returns processing, VAS (value-added services)
A common mistake is treating these numbers as a single flat total. In reality you size each activity on its own channel volume — normal despatch, special/premium and export orders are separate, because each maps to distinct picking, packing and despatch work. Enter each channel directly so the activity that does the work is sized on the volume it actually handles.
Step 2: Model Labour Requirements
Labour is the single largest cost in most warehouse contracts, typically 40-60% of the total. The goal of this step is to convert volumes into full-time equivalent (FTE) headcount using productivity rates.
For each warehouse activity (receiving, putaway, picking, packing, despatch), you need three inputs: the annual volume, a productivity rate per hour, and the productive hours available per day.
FTE Required = Units per Work Day / Productivity Rate per Hour / (Productive Hours per Day x Labour Utilisation %)
Example ND Line Picking: 506,000 lines / 251 days = 2,016 lines/day
FTE = 2,016 / 68 lines/hr / (7.6 hrs x 0.85) = 4.59 FTE
Working days per annum accounts for the site's operating pattern. A standard five-day operation gives you 251 working days (5 x 52, minus 9 public holidays). A six-day site gets 303. Labour utilisation (typically 85%) accounts for non-productive time — toolbox talks, safety briefings, meal breaks, and equipment warm-up.
Sum the FTEs across all activities to get your Total Activity FTE. A typical mid-size warehouse contract might land between 7 and 12 FTE for a single shift.
Step 3: Build the Cost Stack
With FTE requirements known, you can build the full cost structure. A warehouse cost stack has five layers:
| Cost Layer | Examples | Typical Range |
|---|---|---|
| Facility costs | Rent, outgoings, insurance, utilities | $500K - $1.2M |
| Labour (wages) | Store persons, team leaders, agency temps | $400K - $800K |
| Labour (salaries) | Site manager, ops manager, coordinators | $250K - $400K |
| Equipment | MHE leases, IT hardware, consumables | $30K - $80K |
| Startup / implementation | Project team, recruitment, ramp-up | $20K - $50K (amortised) |
Fixed costs (rent, insurance, asset depreciation) stay constant regardless of volume. Variable costs (wages, consumables) scale with FTE and throughput. Startup costs are typically amortised over the contract term — a $30,000 recruitment cost on a three-year deal adds $10,000 per year to the base cost.
Do not forget services like security guards and cleaning. These are often overlooked in early pricing rounds and discovered too late to recover.
Step 4: Allocate Costs Using ABC Methodology
Activity-based costing (ABC) is the bridge between your cost stack and your rate card. Instead of dividing total cost evenly across all services, ABC routes each cost to the pool it actually supports.
A typical 3PL model uses five cost pools:
- Storage — facility rent (client's share by area), property insurance, outgoings
- Activity — wages, MHE lease and maintenance, training
- Fixed Overhead — administration, non-client facility costs, services, salary overheads
- IT — WMS licences, RF scanners, label printers
- Pallet Management — hire pool costs, transfer fees, loss provisions
The client's share of facility costs depends on their warehouse footprint. If the customer occupies 1,074 SQM of a 12,747 SQM site, their client percentage is 8.4%, and they bear 8.4% of rent and outgoings. Storage areas are calculated from pallet counts, asset allocations, and operational space requirements.
Step 5: Generate the Rate Card
Each cost pool maps to one or more rate card lines. The rate is simply the allocated cost divided by the volume that drives it.
Storage cost pool: $733,493 per annum
Standard pallets on hand: 36,000
Storage rate per pallet per annum: $733,493 / 36,000 = $20.37
Storage rate per pallet per week: $20.37 / 52 = $0.39
Activity-based rates follow the same pattern. If the Activity cost pool totals $622,000 and the volume driver for order picking is 62,000 orders, the per-order handling rate is approximately $10.03. Different rate types use different calculation methods: activity rates are per-unit, storage rates are per-pallet-per-week, fixed overhead rates are per-week (site management fee), and consumable rates are cost-plus with a standard markup.
Step 6: Apply Overhead and Margin
Before presenting the rate card, you need to layer on corporate overhead and profit margin. These are typically expressed as percentages of the base warehouse cost.
Industry norms in the Australian market sit around 3% for corporate overhead (head office allocation, shared services, executive costs) and 10-15% for margin. A common structure is 3% overhead plus 12% margin, applied to the base cost before generating the customer-facing rate card.
These percentages should be set at the contract template level and inherited by every site. For multi-site contracts, each site calculates its own base cost, then overhead and margin are applied site by site before rolling up to the contract total.
Step 7: Produce Budget Deliverables
A rate card alone is not enough. Sophisticated 3PL customers expect three financial deliverables:
- Annual Budget — a section-by-section cost breakdown (fixed costs, assets, IT, salaries, activity costs, services, startup) that sums to the total warehouse budget. This is your internal pricing document.
- Customer P&L — a monthly profit and loss statement showing how costs distribute across the year. Activity costs follow a 4-5-4 weekly pattern (4 weeks in month 1, 5 in month 2, 4 in month 3, repeating). Facility rental includes annual rent escalation from the anniversary month.
- Financial Returns — a full P&L plus balance sheet with multi-year CPI projections. Year 2 and Year 3 revenues escalate by CPI (typically 3%). The balance sheet tracks debtors, asset book values, and employee provisions month by month.
For contract renewals, you also need a Budget Comparison that puts the existing contract's costs alongside the proposed renewal, with columns for adjustments and variance analysis.
Common Pitfalls
After working with dozens of warehouse contracts, these are the mistakes that cost operators the most money:
- Stale volume data. Using a 30-day sample from two years ago to price a five-year renewal. Volumes change. Channel mix shifts. Always re-baseline before pricing.
- Double-counting equipment. If the same forklift appears on 14 different task templates, a naive rollup counts 14 forklifts instead of 2. Equipment should be managed at the site level, not per-task.
- Ignoring labour utilisation. Assuming 7.6 productive hours from an 8-hour shift ignores toolbox talks, WHS briefings, and equipment startup. An 85% utilisation factor can swing your FTE count by a full headcount.
- Manual formula errors. One wrong cell reference in a cost allocation formula can misroute hundreds of thousands of dollars between cost pools. If your storage rate looks suspiciously low, check whether insurance premiums are landing in the right pool.
- No audit trail. When the customer asks why their rate increased 8% at renewal, you need to trace the change back to specific volume shifts and cost movements. Spreadsheets do not provide this traceability.
Automating the Pipeline
Every step described above is deterministic. Volumes drive FTEs. FTEs drive wages. Costs flow into ABC pools. Pools generate rates. Rates produce budgets. The entire chain can — and should — be automated.
CostAware was built specifically for this pipeline. Enter your customer's channel volumes and it calculates FTE requirements, builds the full cost stack, allocates costs across ABC pools, generates rate cards, applies overhead and margin, and produces all three budget deliverables automatically. When volumes change, every downstream number recalculates in seconds.
The result is a pricing model that is faster to produce, easier to audit, and dramatically less error-prone than any spreadsheet. For multi-site contracts, site-level costs roll up to a consolidated view with correct SUM aggregation — no manual cross-referencing required.
Ready to move beyond spreadsheets?
Purpose-built for Australian 3PL operators — auditable costing from volumes to rate card.
Book a Free Demo